INSTRUCTIONS
You will be using data collected from wildlife cameras to investigate some aspect of wildlife in Gorgongosa National Park. Read all of the information below carefully, and please follow the instructions outlined below. These data are real, so have fun with it!
Timeline:
Day 1: Read introduction and complete Parts 1-3
Day 2: Complete Part 4
Day 3: Complete Part 5
INTRODUCTION
About the Study Area
Gorongosa National Park in Mozambique is a 1,570-square-mile protected area at the southern end of the African Rift Valley. The valley runs through the center of the park with plateaus to the east and west. Water flows from Mount Gorongosa, down the Cheringoma Plateau, into Lake Urema in the center of the valley. During the wet season, from January to March, Lake Urema expands to over 10 times its size, covering the grassland in the center of the park. During the dry season, from July to September, the lake contracts. The grassy plain provides rich, nutritious grass for many of the park’s herbivores. As the dry season progresses, the grass throughout the park slowly turns brown and dies. This dry grass fuels large wildfires that burn sections of the park in the late dry season until the rains come again.
Four broad vegetation types make up the Gorongosa ecosystem. Grasslands cover almost 20% of the park, primarily in the center. The grasslands are maintained by the seasonal flooding of Lake Urema and its rivers, by natural fires in the dry season, and by grazing herbivores. Elephants also play their part by knocking down trees along the edges of the floodplain. Grasslands are an extremely productive ecosystem, providing food to support a vast diversity of species. Gorongosa’s large grazers, including hippos, buffalo, wildebeest, zebra, and waterbuck, eat a staggering amount of grass each day and help “mow” tall grasses, creating patches of short grass. Smaller antelope, like impala, reedbuck, and oribi, feed on the lush, green grass shoots that grow in these short patches. These herbivores attract large predators, like lions.
The mixed savanna and woodland vegetation type is found in the rift valley. It includes distinct forest patches—with bright yellow fever trees, tropical palm trees, and miombo woodland— which provide habitats for many different wildlife species, from insects to elephants. The tree canopy of the savanna patches is open, allowing enough light to reach the ground for grasses and herbs to blanket the ground. This vegetation type also provides different habitats at different vertical layers, from grass, flowers, and leaf litter on the forest floor, to short shrubs and tree trunks, to tall trees of different heights. The combination of forest and savanna patches across the landscape and the diversity in vertical habitats allows nearly all of Gorongosa’s species to live in this vegetation type.
The most common type of forest in Gorongosa is the miombo woodland. Miombo is the Swahili name for the most prevalent type of tree from the genus Brachystegia. The smallleaved Brachystegia trees can grow in poor soils and are commonly found in the rocky plateaus to the east and west of the rift valley. Miombo woodlands are home to many of Gorongosa’s antelopes that feed on leaves (browsers), including impala, bushbuck, nyala, kudu, eland, and sable antelope. Some of these antelopes are mixed feeders that also eat grass. Primates, like baboons, vervet monkeys, and bushbabies, are commonly found in woodland habitat, foraging on the ground or high in the trees. Birds, reptiles, amphibians, and insects, also found in miombo woodlands, are an important food source for small carnivores, like mongooses, genets, and civets. Because this forest is dominated by a single type of tree, there is typically less diversity of animals here than in the patchy woodland/savanna habitat.
The limestone gorges of Gorongosa National Park were formed over many millions of years as erosion from rivers and rain carved out deep gorges in the side of the Cheringoma Plateau in the eastern side of the park. Many of these gorges still contain small rivers surrounded by lush, riparian forest. The gorge stays cool and moist, even in the dry season, and provides nutritious green vegetation for a variety of animals year-round, including antelopes, baboons, birds, and carnivores. Sunlight only reaches the floor of the gorge for a limited period of time each day, so very little grass covers the ground. Primates, like baboons, and birds are especially common in these gorges, as are small antelopes that prefer dense forest. Massive animals, like elephants and hippos, and herbivores that eat only grass are much less common.
Humans are also a part of the Gorongosa ecosystem. Tourists stay in the Chitengo camp inside the park and drive on dirt roads to view animals during the day. Some animals are very used to these vehicles, while others, like elephants, tend to avoid them when they can. Local people live in villages around the park, and some live very close to the park borders. Many of these people grow crops on small farms next to the park, and animals, including elephants, hippos, and baboons, visit these farms to feed on crops. Crop raiding by animals can wipe out a family’s food source in the course of a single night, so villagers use various techniques, like loud noises and the scent of chili peppers, to repel animals.
About the Project
Lion researcher Paola Bouley and her team use motion-detecting trail cameras to learn more about Gorongosa’s lions. Lions are not the only animal captured by these cameras. The photos provide valuable information on a variety of different animals, including numbers to help estimate populations, behaviors, and interactions with other animals. The public has identified animals and collected data from the photos on a citizen science website called WildCam Gorongosa (www.wildcamgorongosa.org). The WildCam Lab is a part of WildCam Gorongosa where you can view trail camera data on a map, filter, and download the data to investigate scientific questions.
The process of science is iterative and adaptable. The first step in scientific inquiry typically consists of making observations about the natural world. Observations can inspire questions about phenomena, to gain understanding about how nature works. For scientists to answer a question, it must be testable, meaning that it could be answered by designing an experiment and/or collecting data. After identifying a testable question, the scientist may form a hypothesis, which is an explanation for the observed phenomenon, based on observations and/or prior scientific knowledge. Before collecting data, the scientist may also predict the expected results of the investigation if the hypothesis is supported. The scientist can test the hypothesis through experimentation or further observation, followed by an analysis of the data collected.
In this activity, you will learn firsthand what it is like to be an ecologist studying Gorongosa’s wildlife. You will use actual trail camera data to generate a testable question, form a hypothesis and prediction, and choose and analyze the appropriate data to answer your question from the WildCam Lab. The results of your investigation may contribute to the conservation effort in Gorongosa National Park.
PROCEDURES AND QUESTIONS
Part 1: Making Observations and Asking Questions
Visit WildCam Gorongosa (www.wildcamgorongosa.org) and create an account or sign in with your existing account. Click the “Get Started” button and read through the tutorial.
As a group, spend 10 minutes observing and identifying animals. Individually record your observations and questions below. As you work, consider the following questions:
- What do you notice? What do you wonder?
- Which animals have you identified in the pictures? How many?
- What are the animals doing? What environment are they in?
- If there are pictures with no animals, what other observations can you make?
- What questions do you have?
Part 2: Testable Questions
A good research question is one that can be answered by performing an experiment, collecting data, or analyzing existing data. In order to determine which questions you can answer, you need to know which kinds of data can be gathered from the trail camera photos.
As a group, brainstorm which kinds of data you can gather from the trail camera photos. Individually record your list in the form below:
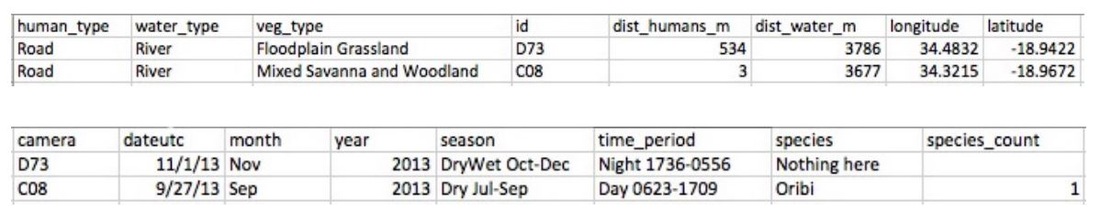
The spreadsheet below shows a sample of the types of data that can be collected from the WildCam database for a set of images. Think about which of the questions that you came up with are potentially testable using these data. Spend five minutes modifying your questions or writing more questions that could be answered with data from WildCam pictures. Individually write at least three testable research questions and enter them in the form below.
Part 3: Hypothesis, Prediction, and Variables
Now that you know the types of data that are available, it is time to select your research question and formulate a hypothesis and prediction. Then, you will make a plan for collecting data that will allow you to test that hypothesis.
Before you explore your own question, we will walk you through the process of making a hypothesis and a prediction using the following example question: During which season is the highest abundance of animals present in the limestone gorge vegetation type? You may be able to generate some possible answers to this question just by exploring the Gorongosa National Park Interactive Map (http://www.hhmi.org/biointeractive/gorongosanational-park-interactive-map). Visit the map, click on the limestone gorge and vegetation type layers, and read about the various vegetation types. You might discover that the limestone gorge vegetation type has streams that flow year-round and lush, green vegetation, even during the dry season. Vegetation typically dries out and dies in the other vegetation types during the dry season.
A possible hypothesis would be: In the limestone gorge vegetation type, animals are most abundant in the dry season because they are attracted to the water and green vegetation that is scarce in other areas.
Before analyzing data, scientists will typically predict the results or observations that would be generated if the hypothesis were supported. In our example, a prediction might be: I will find more animals in photos during the dry season than during any other season in the limestone gorge vegetation type.
Decide on a single research question and write a hypothesis and prediction.
Click on one of the following links to open a document for you (if working alone) or your group to work together on. Please write your names at the top of the page before entering any other information. All of the remaining information for this project will be inserted into this document.
An independent variable is the variable you are studying the effect of, and the dependent variable is the variable that is affected by (or depends on) the independent variable. For example, for the question “During which season is the highest abundance of animals present in the limestone gorge vegetation type?” the independent variable would be the season and the dependent variable would be the number of animals found in the limestone gorge in each of those seasons.
Which variables from the spreadsheet will you need to include in your analysis to test your hypothesis? Record these in your document.
Part 4: Data Collection
You will now gather the data for your research question using the WildCam Lab (https://lab.wildcamgorongosa.org/students/data).
First decide which of the filters you will use to collect data that are relevant to your research question. List these in your document.
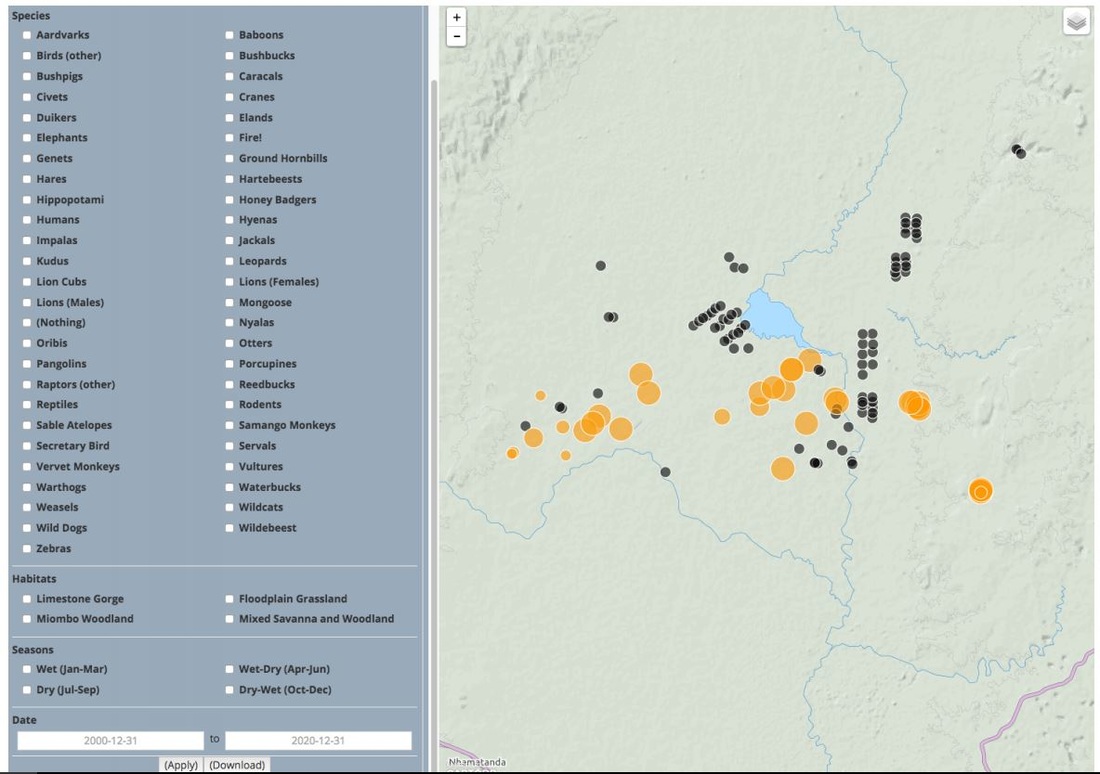
Use the WildCam Lab to filter the data and download a spreadsheet that will help you answer your research question. If you discovered as you worked through the filter options that you might not be able to filter the appropriate data to address your question, you may need to edit your question or pick a new one. Refining or changing your question based on the available data is a regular part of the iterative process of science.
After downloading your data, insert it into your document. If the table is too big to include in your report, take a screenshot of a sample of your data and insert that sample. Make sure to include the table headings in your sample. Also remember to give your table a descriptive title.
Follow the instructions in the WildCam Tutorial linked below to process your data using a pivot table in Excel. Insert your pivot table into your document. Make sure your table has appropriate headings and a descriptive title.
| wildcam_tutorial.xlsx |
Use the spreadsheet tutorial provided to organize your data and create a graph. Insert it into your document. Remember to label your axes appropriately (including units) and give your graph a descriptive title.
Part 5: Data Analysis and Conclusion
Analyze your data by describing the trends in your graph. Be as descriptive as possible. Point out any outliers or anomalies.
Come to a conclusion based on the data you collected. Are your hypothesis and prediction supported? Explain your answer using evidence from the graph. Also try to explain why you saw particular trends (or didn't see trends where you might have expected them).
Evaluate the data you used and the methods you used to process the data. What are the potential limitations of trail camera data? Identify at least two potential biases of trail camera data or with the way the trail camera survey was designed and include this in your evaluation. Suggest ways that you could minimize these limitations.
Based on the results of this investigation, what are some additional research questions that could be further investigated to gain a deeper understanding about the animals in Gorongosa National Park? Record these questions at the end of your report.